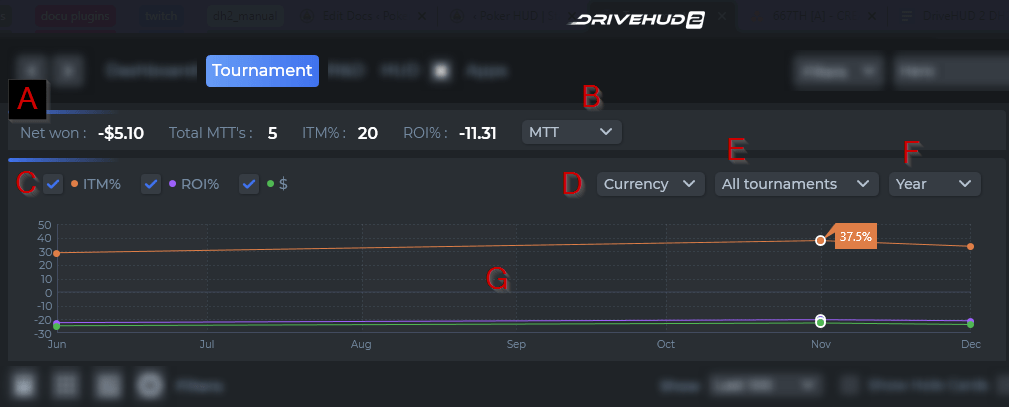
A) Tournament Results OverView – Here you’ll see a brief overview of how many MTT’s, and S&G’s you’ve played, along with how many you’ve won plus ITM% and ROI% data.
B) Tournament Results OverView Selector – From this drop-down menu, you can select to display all tournaments, S&G or MTT Overview data.
C) Graphing options – You can add the following data points to your graph by clicking on the box next to each. ITM% – In the money percentage is the percent of the time you made the money in a tournament. ROI% – Return on Investment percentage is an overall percent that you profited from tournament play. Your total amount paid into tournaments divided by the total profit you made. $ – Total dollars won from tournament play.
D) Currency Selector – From this drop-down menu, you can select currency, chips or BB.
E) Tournament Selector – From this drop-down menu, you can select to display all tournaments, S&G, or MTT Graph data.
F) Graph Iterations – You can select the length of time that your chart shows, for this current week, the current month, or year.
G) Graph plot points – You can mouse over any point in the graph to get the data related to that line bar graph.