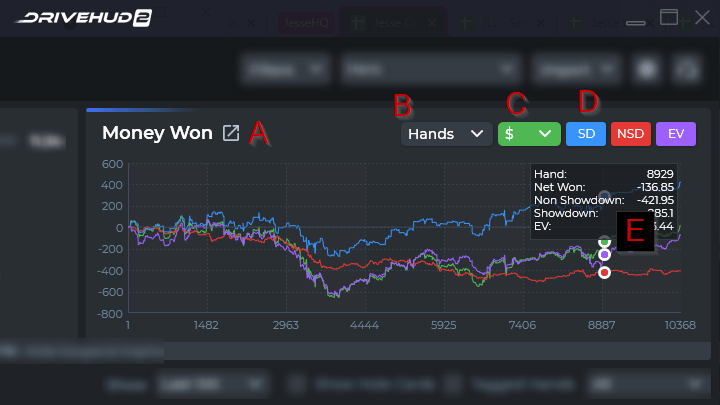
A) Pop-out Button – When you click on this button, the graphs will create a pop-out screen with several more graphing options.
B) X-axis Graphing Options – You can select which data parameters display on the X-axis of your graph by four options, Hands, year, month, and week.
C) Y-axis Graphing Options – You can have your Y-axis data displayed by total dollars won, or by big blinds.
D) Graphing options – When you click on any of the graphing options, it will display or remove them from the graph. SD = Showdown winnings, NSD = Non-showdown winnings, EV = Expected value when all-in.
E) Graph Summary – If you mouse over any place on the graph, you’ll see a summary of each line of data you have selected for your graph.
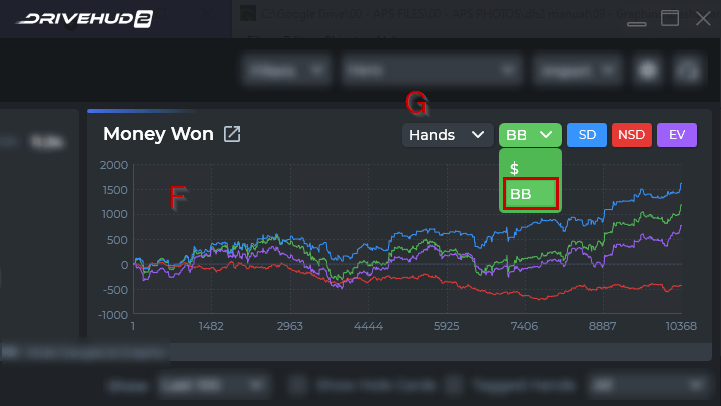
F) BB/100 Graph – This graph will display your BB/100 winrate.
G) X-axis Options for bb/100 – You can display your data based on total number of hands, year. month, or week.