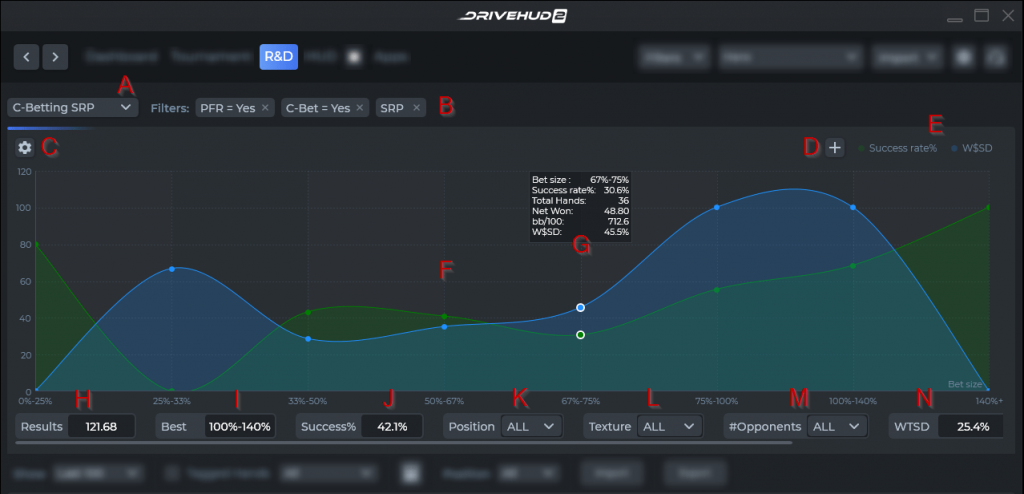
A) Situation Drop Down – From here, you can select your situation such as C-Betting SRP, C-Betting 3-Bet, C-Betting 4-Bet, 3-Betting, 4-betting, Turn bet, River bet, Turn Play, River Play, Flop raises, Turn raises, Turn probe, River raises, River probe and Flop check-raises.
B) Filter for hands – Same as normal hand filters. You can click the ‘x’ button on each filter to remove them.
C) Graph Configuration – Click on this button to view the pop-up window (shown below) for configuring your graphs. You can change the name, graph type, x-axis stat, ranges, y-axis stat and label, color, game type, and filters.
D) Add Stat to Graph -Click on this button to add various stats (bet size, bet size in BB, pot size, board texture, etc.) to the graph. You can also set the axis label and color.
E) Stats in Graph – Names are configured from Letter D.
F) Graph per Stat – Here you can see each graph; one curve per selected stat on E.
G) Graph point details – Hover on any point in the graph to display more details.
H) Net Won Stat – you can specify your own text here.
I) Best/Worst Range – Click the result text to toggle between your best and worst range.
J) Success Rate Stat – displays your success rate.
K) Show Position in X-axis – click on the drop-down to select your position.
L) Base Calculations on hands that meet selected texture – click on the drop-down to select various textures such as Rainbow, TwoTone, ThreeTone etc.
M) Base calculation on hands that have the same amount of players that selected – click on the drop-down to select the no. of opponents.
N) WTSD% Overall Stat – displays your overall WTSD in percentage. Click to view its graph.