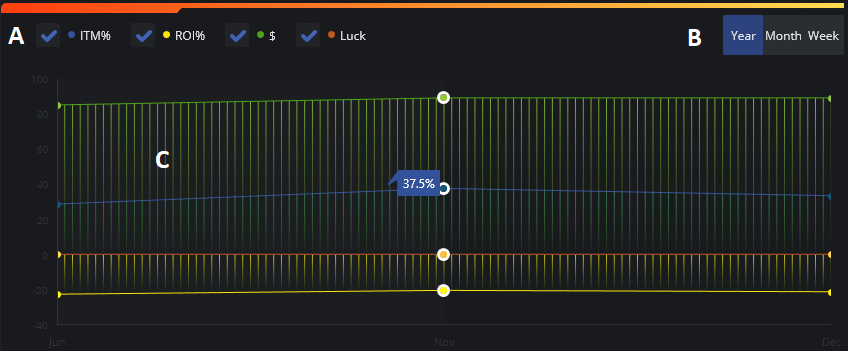
A) Graphing options – You can add the following data points to your graph by clicking on the box next to each. ITM% – In the money percentage is the percent of the time you made the money in a tournament. ROI% – Return on Investment percentage is an overall percent that you profited from tournament play. Your total amount paid into tournaments divided by the total profit you made. $ – Total dollars won from tournament play. Luck – The total percentage of the time you’ve been all-in, and survived in a tournament.
B) X-axis options – You can display your line bar graph by year, month, or week.
C) Graph plot points – You can mouse over any point in the graph to get the data related to that line bar graph.