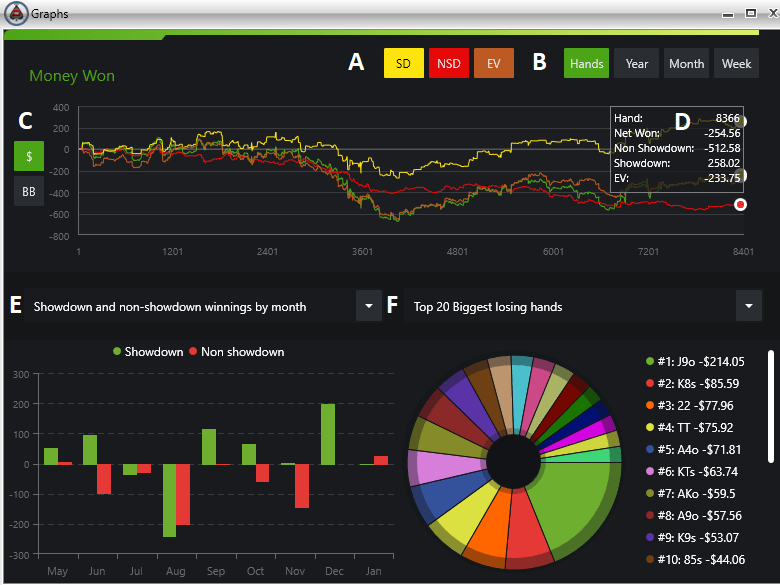
A) Graphing options – When you click on any of the graphing options, it will display or remove them from the graph. SD = Showdown winnings, NSD = Non-showdown winnings, EV = Expected value when all-in.
B) X-axis Graphing options – You can select which data parameters display on the X-axis of your graph by four options, Hands, year, month, and week.
C) Y-axis Graphing options – You can have your Y-axis data displayed by total dollars won, or by big blinds.
D) Graph summary – If you mouse over any place on the graph, you’ll see a summary of each line of data you have selected for your graph.
E) Line bar graphs – From this drop down you can select several graphing options to display. Showdown and non-showdown winnings by month, which is the total amount of money you’ve won at showdown compared to winning without showdown. Showdown and non-showdown winnings by year, which is the same thing, but displayed by year. Money won by cash game type, which will graph how much you’ve won at the different poker games you play. Money won by tournament game type, which will graph how much you’ve won by each tournament buy-in and type. EV difference to realized EV by month, which will display what your all-in EV should be versus what your actual realized EV was.
F) Pie chart graphs – From this drop down you can select several pie chart styles graphs. Top 20 biggest losing hands shows the biggest losing hands you have in order or worst loss. Top 20 winning hands, is the same thing, but for the hands you’ve won the most with. Money won by position will display how much you’ve won from each general position at the table. Bb/100 by time of day will show you when your most profitable hours of play are.