How do I create a custom R&D report?
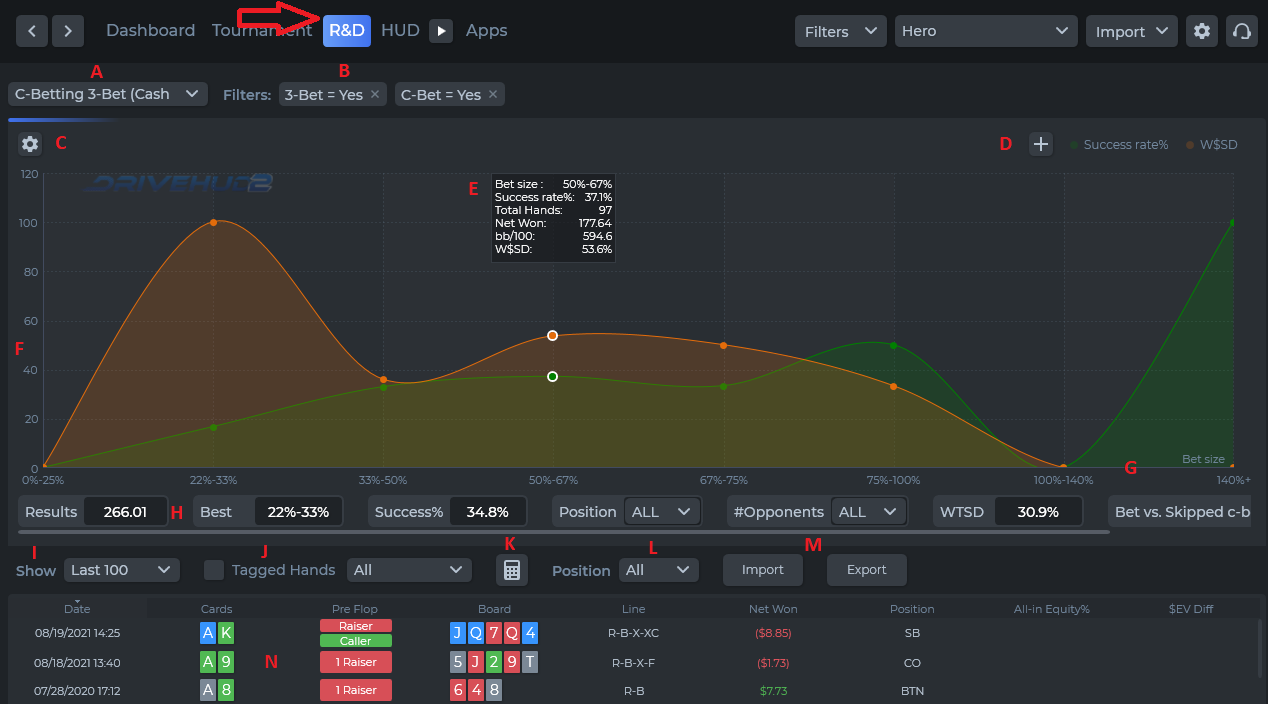
INTERFACE OVERVIEW
- Pre-built R&D reports – From here you’ll find a pre-built list of R&D reports that you can run and edit.
- Currently built filters – This section shows you what filters you currently have selected. Click on the X at the top right-hand side to remove any filters you no longer want.
- Main R&D Config Screen – This pop-up menu allows you to edit existing R&D reports, or create new ones.
- Graphing lines – This shows you what the currently set graphing lines represent. You can remove or edit any of them by right-clicking and selecting delete, or edit. You can add a new graphing line option by clicking on the +.
- Mouse over graphing data – If you mouse over any dot on the graph, you’ll get additional pop-up data and stats for that part of the graph.
- Graph Y Axis – The Y axis data will display on the far left side of the R&D graph. What your graphing lines are set as will influence and change the depth of your Y axis.
- Graph X Axis – This will be labeled and shown at the bottom of your R&D graph. In the above example, your X axis is bet sizing in relation to pot size.
- Widgets – These are several quick ways to change the graphing display data, and drill down to see and understand your current R&D project easier. A single click on a widget will change the graph. If you right-click on a widget you can edit or remove them. To add a new widget, locate the + symbol at the far right end of your current widget list.
- Last hand pull down – A pull down option to limit the display of the current hands you’re looking at. You can set this to a specific # of hands or all hands.
- Tagged hands – If you tagged any hands during game play, or post game analysis, you can show those hands only by checking the box next to the tagged hands pull down. By clicking the pull down menu, you can select which tagged hands you want to look at, or all of them.
- Equity Calculator – This will launch the DriveHUD EQ Equity calculator.
- Hand grid position pull down – You can select In position (IP), Out of position (OOP), or any position from the pull down menu. The Hand history grid will then show only hands from those positions. All positions are post-flop only.
- Import / Export Reports – Any R&D report you create, you can export and share with someone else, or import one someone has shared with you.
- Hand history grid – This is where all hands are displayed that relate to your R&D report. If you click on any data point in your graph (Section E), the hand history grid will re-populate with only hands related to the data point you clicked on.
Main R&D Config Screen [How to create a new R&D report or edit an existing one]
Create a new R&D Report – Click on the R&D pull down menu at the top right-hand side, and select the first option – Create new R&D.
Edit an existing R&D Report – When you have an R&D report loaded from the R&D pull down menu, you can edit the existing report by clicking on the gear config icon located below the pull down menu (Section C above). You can DUPLICATE the existing report, edit it, and then save it again with a new name. You can also edit the graphing lines by right-clicking on any of the graphing lines (Section D above) and select edit. Furthermore, you can also edit any existing widget by right-clicking on the widget, and clicking edit.
Creating a new R&D Report [Step-by-step]
Once you’ve clicked on the R&D pull down menu and selected Create new R&D, you’ll need to do the following:
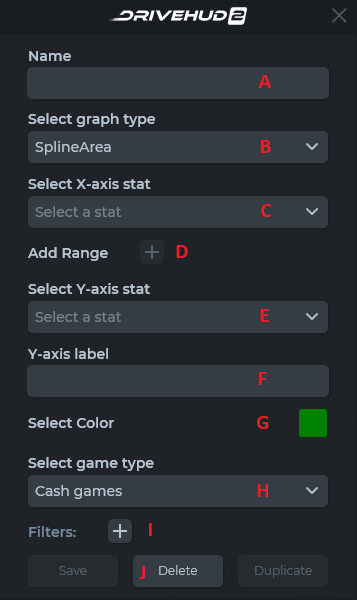
- This is where you’ll enter a name for your R&D report.
- Select an option for what kind of graphing line you want to display. There are several options, and you can come back and change these at any time.
- Select the stat you’d like to display on your X-axis (bottom of the graph). The top options in the pull down menu include many default options. For example, if you select bet size, you’ll get a pre-configured range of bet sizes that you can edit, delete or add to. You can have a MAX of 9 ranges for any stat.
- Click the + to add a set of ranges for the stat you’re entering. If the stat is a percentage, include the % while adding the ranges. EX: 30% – 40%. If you want the last range to be any number that’s over the last set of ranges, enter the same number for the high and low range with a + at the end. EX: 100%+ – 100%+. This will graph as any number over 100%.
- Select the Y-axis stat (left side of the graph) you’d like to graph. You can search for a stat by typing in any part of the stat and it will autocomplete or list related stats.
- Enter a label you want to be displayed for your Y-axis.
- Select a color for your Y-axis plot line.
- Select which games you want to analyze, cash, S&G, MTT, all tournaments, or all cash hands. If you want to analyze only a specific game type or format, you can add a filter from Section I below.
- You can add any filter to your graph by clicking the + symbol. This will bring up the standard filters screen, which will allow you to create a more specific situation or game type to your analysis.
- You can Save, Delete, or Duplicate an R&D. If you duplicate an R&D it will make an exact copy of all of your settings, including your widgets.
GRAPHING LINES [Adding new ones or editing existing ones]
After you create your main graph for your R&D, you can add as many additional graphing lines as you’d like. Keep in mind that the stats you select to graph will change the dimensions of the graph. It’s always best to choose stats that will stay reasonably within the same range.
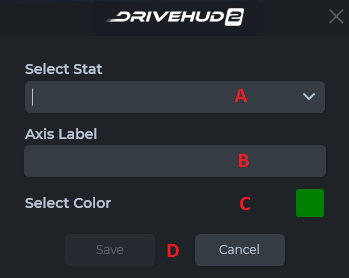
- Select the Y-axis stat (left side of the graph) you’d like to graph. You can search for a stat by typing in any part of the stat and it will autocomplete or list related stats.
- Enter a label you want to be displayed for your Y-axis.
- Select a color for your Y-axis plot line. Make sure to make your color different from your initial Y-axis stat.
- Click here to SAVE or Cancel your new stat plot line.
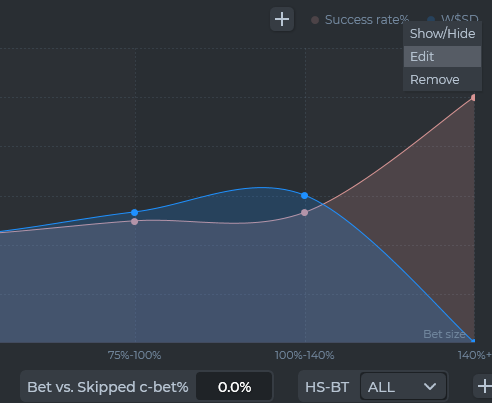
If you right-click on any existing Y-axis graphing line, you can select to show/hide it, edit it, or remove it for good. If you select show/hide, it will temporarily remove it, but it won’t delete it from your R&D, so that next time you load it, the graphing line will return.
STAT WIDGETS [Creating new ones or editing existing ones]
Create a new widget – To create a new widget click on the + sign that is located between the main graph screen and the hand history grid. If you have existing widgets on your screen and don’t see a + sign, use the scroll bar and move it to the right until you see it.
Edit an existing widget – To edit an existing widget, simply right-click on it and select edit. To delete a widget, right-click and select remove.
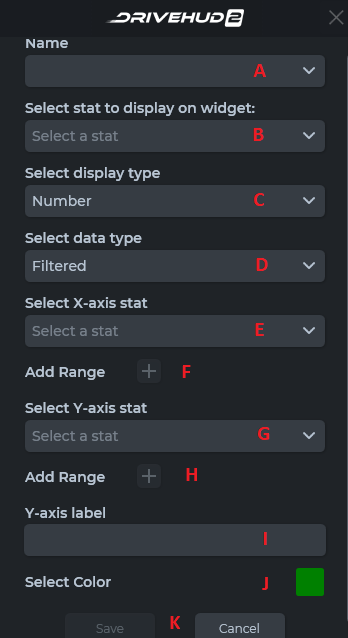
- This is where you’ll enter a name that will display for your widget.
- This option will allow you to select which stat you want to display on the main window of the widget. The first eight options have pre-built pull downs. For example, position will list all the main positions at the table or all positions. Number of opponents will have a pull down with options of 1-4+ or all. You can add any stat though, and you can begin typing the stat name to do an automatic search of the stat you’d like to add.
- This is an option on how to display the data on the widget. You have four options. Number will display the stat from Section B above as a static number that you can view. Drop down will show a drop-down menu of options for your stat. A vertical line or Horizontal line will show a visual clickable graph for your widget.
- You have two data type options. Filtered or overall. Filtered will show data + any related added filters. Overall will show all data that is set in this widget.
- Select the stat you’d like to display on your X-axis (bottom of the graph). The top options in the pull down menu include several default options. For example, if you select bet size, you’ll get a pre-configured range of bet sizes that you can edit, delete or add to. You can have a MAX of 9 ranges for any stat.
- Click the + to add a set of ranges for the stat you’re entering. If the stat is a percentage, include the % while adding the ranges. EX: 30% – 40%. If you want the last range to be any number that’s over the last set of ranges, enter the same number for the high and low range with a + at the end. EX: 100%+ – 100%+. This will graph as any number over 100%.
- Select the Y-axis stat (left side of the graph) you’d like to graph. You can search for a stat by typing in any part of the stat and it will autocomplete or list related stats.
- Click the + to add a set of ranges for the stat you’re entering. If the stat is a percentage, include the % while adding the ranges. EX: 30% – 40%. If you want the last range to be any number that’s over the last set of ranges, enter the same number for the high and low range with a + at the end. EX: 100%+ – 100%+. This will graph as any number over 100%.
- Enter a label you want to be displayed for your Y-axis.
- Select a color for your Y-axis plot line. Make sure to make your color different from your initial Y-axis stat.
- You can Save, Delete, or Duplicate an R&D. If you duplicate an R&D it will make an exact copy of all of your settings, including your widgets.
ADDITIONAL VIDEO CONTENT [How to create a custom R&D report from scratch]